In
this tutorial we'll use some of CorelDRAW's excellent tools for
creating infographics and flowcharts. Using the Connector Tools, found
in the Toolbox, we'll quickly and easily draw lines from various nodes
to create a fantastically designed flowchart. You'll also learn
techniques in using the Pen Outline Tool, Attributes Eyedropper, and the
Smart Fill Tool.
1. Setting Up the Document's Layout
Step 1
Create a New Document and use the Rectangle Tool (F6) to draw a large rectangle over over your document page. Set the rectangle's color in the Object Properties docker.
Draw a small rectangle and adjust the corner's radius in the Property Bar to 0.22" or so. Hit No Outline under the Outline Pen (F12) and set the fill color in the Object Properties docker.

Step 2
Figure out your infographic's layout by drawing various rectangles and circles with the Rectangle Tool and the Ellipse Tool (F7). Use the Smart Fill Tool
to fill your current rectangle (or any shape) with any color and you'll
instantly have a copy of that rectangle in a new color, eliminating the
need to Copy (Control-C), Paste (Control-V), and recolor singular objects. Set up your fill and outline options in the Property Bar.

Step 3
A graphic like this works well with a limited color palette. I chose brown, teal, pink, and white. Group (Control-G) together your objects once satisfied with their placement.

Copy, Paste, and recolor all of the objects in the group to dark teal in the Object Properties panel.

Place the pasted group behind the original group in the Object Manager docker. Use your arrow keys to move the pasted group down and to the right so it's offset slightly (see below).

2. Using the Connector Tools
Step 1
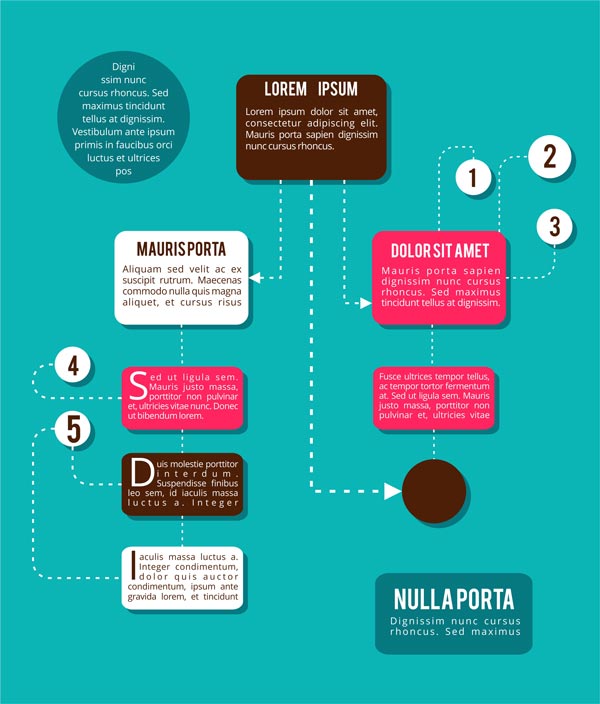
Using the Right-Angle Connector, connect the top brown box to the brown circle.

In the Property Bar, choose from a variety of arrow styles for the path's end cap.

Adjust the connector stroke's style, radius, and size in the Property Bar.

Step 2
Select the connector and choose a color with the Outline Color Tool (Shift-F12). Choose a color that easily stands out from your background color.

I
chose a white dotted line with an arrow on the right side of the
connector line. Draw another connector line from the top rectangle to
one of the rectangles on the side (try the top shape in the left
column).

Step 3
Let's
say you've been playing with different connector lines and styles and
want to easily change one or more to an existing color and style. Choose
the Attributes Eyedropper from the Toolbox, sample the connector you want to keep, and apply it to the other two connector lines.
Every attribute of the sampled object will transfer over to the object to which the eyedropper is applied.

Step 4
Connect the smaller rectangles to each other with the Straight-Line Connector Tool. Connect the circles to the rectangles with the Rounded Right-Angle Connector Tool.

3. Finalize Your Design
Step 1
If you find you don't like your layout, use the Pick Tool to
drag objects around your layout, and you'll notice that the connector
lines, unless deleted, will change with the moved object. Additionally,
not all of the objects need to be connected or have the drop shadow
applied earlier.

Step 2
Use the Text Tool (F8) to
write out information or filler text on each of your flowchart's
objects. Choose header and body text and adjust text attributes in the Text Properties docker. For more on using the Text Tool in CorelDRAW, check out How to Use the Text Tool in CorelDRAW.
Great Job, You're Done!
CorelDRAW has
fantastic tools for the creation of infographics. From its Text Tool
to Perfect Shapes to these Connector Tools, the process of creating
various styles of graphics is streamlined and incredibly easy. Check out
these relevant CorelDRAW tutorials for more tools in creating
informative illustrations:
- How to Use the Text Tool in CorelDRAW
- How to Create and Use Perfect Shapes in CorelDRAW
- CorelDRAW: Shape Building Basics